(Mass) Spectrum
Background
Many analytical instruments characterize a sample by outputting a spectrum, which represents, in the form of a plot or data table, how some observed signal from a detector varies continuously as a function of another parameter. Many types of spectra exist. A mass spectrum, which is obtained in a mass spectrometer analysis and is therefore of interest to many SIMION users, is a plot or histogram of the signal intensity v.s. mass-to-charge ratio (m/z) for an ion population. An energy spectrum, which may be obtained in electron spectroscopy with an Hemispherical Deflection Analyzer (HDA), is a plot of intensity v.s. particle energy (rather than mass). An ion mobility spectrum, which is obtained in ion mobility spectrometry, is a plot of intensity v.s. drift time through a medium (related to particle size and shape). A frequency spectrum, such as obtained in ion cyctrotron resonance (ICR) mass spectrometry or in an orbitrap, is a plot of intensity v.s. frequency of a current signal, which might in turn infer a mass spectrum. Other types of spectra exist, such as absorption and emission spectra representing things like intensity of v.s. wavelength for light, but these don’t necessarily involve charged particles and therefore are of lesser interest in the context of SIMION.
For a mass spectrum, the two axes are interpreted as follows. The intensity in the signal depends on the type of detector used but is typically a current or particle count, which for quantitative purposes if ideally (but not necessarily) roughly proportional to the number of particles hitting the detector (at least within the “linear dynamic range” of the detector). The m/z ratio conventionally assumes masses in Daltons (u) and charge in elementary charge units (u). The m/z ratio actually is not measured directly but rather inferred from the instrument, which may record position (using detector arrays), time (e.g. SIMION Example: TOF), electrode scanning voltage (e.g. Ion Trap), or an induced current frequency signal (e.g. ICR). For some types of mass spec sources, it’s usually the case that z = 1 (e.g. single charged cations typical in EI sources), but in other cases, different peaks may often correspond to different z values (e.g. typical in ESI sources), so it’s really a mass-to-charge spectrum not a mass spectrum.
See also Wikipedia: mass_spectrum.
SIMION Specific
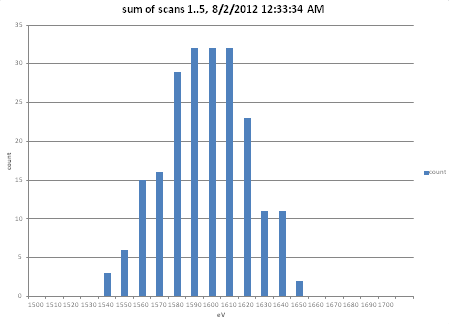
Fig. 84 Figure: Rough spectrum obtained via SIMION Example: spectrum
SIMION can be utilized to simulate a complete mass spectrum (or other type of spectrum involving particle counts) for the purpose of determining things such as peak shape and the inherent resolution or resolving power of the instrument. A few points to consider:
Scanning: Depending on the type of mass analyzer being simulated, you may need to scan electrode voltage and acquire ion trajectories over the scan. See SIMION Example: tune, SIMION Example: spectrum, and SIMION Example: hda for examples and notes on voltage scanning from a user program. Other mass analyzers like SIMION Example: tof do not require a voltage scan.
Particle starting conditions: You will need to appropriately define the starting conditions of your particles traced–in terms of time, space, and energy– to be statistically representative of the much larger population of actual particles that would physically exist in your system. A spread in particles at the source will result in additional spread at the detector and hence peak broadening. As a Monte Carlo Method simulation, a large number of particles may be necessary to obtain smooth peak shapes. You may compare results with different numbers of particles.
Acquisition point: You will need to acquire data at the detector. Data can be acquired upon particles splatting on a (detector) electrode, upon passing an orthogonal plane (via Data Recording, When=Crossing Plane), or from a user program upon passing arbitrary planes (see SIMION Example: test_plane).
Output, processing, and plotting: You could acquire particle splat data and Exporting “data recording” results to text file using Data Recording and then use some external program (e.g. Excel or Matlab) to analyze or plot the data. Alternately, you can do the analysis and plotting entirely from a SIMION user program, like in SIMION Example: spectrum. Both cases typically will involve some type of “binning” to generate a histogram from particle counts. If generating the spectrum via user programming,
simionx.Statistics make_histogram()can help (as shown in SIMION Example: spectrum). In the case of ICR, you probably want to apply an FFT, either via an external data analysis program or your own user library loaded into or invoked from SIMION. See also SIMION Example: plot (or SIMION Example: excel or SIMION Example: gnuplot) for plotting capabilities.Space-charge: Space Charge can broaden peak shape, lead to saturation effects, and cause coupling effects between peaks. You may or may not want to account for space-charge effects.
Other spectrum types: Spectrums for quantities other than mass may also be done. For example, SIMION Example: hda creates an energy spectrum and SIMION Example: faims plots a mobility spectrum, but the method is similar to SIMION Example: spectrum.
Resolution and Resolving Power
Peaks that partially overlap might not be distinguishable.
For a given instrument, the smallest difference in m/z between
two peaks still distinguishable is referred to as  .
There are different ways to define , such as by
full width at half maximum (FWHM) or a % valley.
Depending on the instrument,
might be constant or it might vary as a function
of
.
There are different ways to define , such as by
full width at half maximum (FWHM) or a % valley.
Depending on the instrument,
might be constant or it might vary as a function
of  .
The same is true of the quotient
.
The same is true of the quotient  .
The values and have been
termed resolution and resolving power, sometimes interchangeably
in a confusing way.
For details, see the links below.
.
The values and have been
termed resolution and resolving power, sometimes interchangeably
in a confusing way.
For details, see the links below.
O. David Sparkman. Mass Spectrometry Desk Reference. G: i2arPAAACAAJ. 30 June 2006. Global View Pub. ISBN: 978-0-9660813-9-8 . p. 55 – “resolving power”, “resolution”
Computing FWHM
Standard deviation provides a simple and robust measure of spread. Another statistics often used is full-width-at-half-maximum (FWHM), which measures the distance between positions on the peak where intensity is 50% of the maximum value for intensity in the peak.
One way to compute FWHM is to store the intensity values in a Lua table, sorted by mass. Find the maximum value in that table. Then find the indexes in the table where the intensity crosses half maximum. Note: Double peak or noise could cause multiple sets of points where the intensity crosses half maximum. The below code illustrates what you can do, although improvements could be made:
-- Build example peak
local masses = {}
local intensities = {}
for i=1,100 do
  local mass = 10 + (i-1)*0.1
  local intensity = 3*math.exp(-(mass-15)^2)
  masses[i] = mass
  intensities[i] = intensity
  print(mass, intensity)
end

-- Compute FWHM statistics
local function stats(masses, intensities)
  -- Get index where intensity is a maximum.
  local maxi = 1
  for i=1,#intensities do
    if intensities[i] > intensities[maxi] then
      maxi = i
    end
  end

  -- Half-maximum intensity
  local halfmax = intensities[maxi] / 2

  -- Find indices where intensity crosses half-maximum
  local crosses = {}
  for i=0,#intensities+1 do
    local i1 = intensities[i-1] or 0
    local i2 = intensities[i] or 0
    if i1 < halfmax and i2 >= halfmax or
       i2 < halfmax and i1 >= halfmax
    then
      table.insert(crosses, i)
    end
  end

  if #crosses < 2 then  -- peak not found
    return nil
  end

  local imin = crosses[1]
  local imax = crosses[#crosses]
  local massmin = masses[imin]
  local massmax = masses[imax]
  local deltamass = massmax - massmin

  return maxi, deltamass
end

local maxi, deltamass = stats(masses, intensities)
print('maxintensity=', intensities[maxi], 'maxmass=', masses[maxi], 'deltamass=', deltamass)
See Also
SIMION Example: spectrum - main example of generating spectrum in SIMION.
VirtualDevice Data Analysis has a spectrum plotting and analysis function based on SIMION Data Recording output.
Some examples:
RaoPrabhudesai2011. Rao, K. C.; Prabhudesai, V. S.; Kumar, S. V. K. A time of flight mass spectrometer with field free interaction region for low energy charged particle-molecule collision studies. Review of Scientific Instruments. volume 82, issue 11, year 2011, pages 113101. doi:10.1063/1.3653393 – compares SIMION simulated and experimental spectra of TOF-MS.
PrasadTang2009. Prasad, Satendra; Tang, Keqi; Manura, David; Papanastasiou, Dimitris; Smith, Richard D. Simulation of Ion Motion in FAIMS through Combined Use of SIMION and Modified SDS. Analytical Chemistry.: volume 81, issue 21, year 2009, pages 8749-8757. doi:10.1021/ac900880v - simulated and experimental spectra in FAIMS (with mobility/diffusion SDS effects), also referenced in SIMION Example: faims.
KimKing2008. Kim, Moon S.; King, Todd T.; Getty, Stephanie A.; Roman, Patrick A.; Herrero, Federico A.; Jones, Hollis H.; Kahle, Duncan M.; Lynch, Bernard; Suárez, George; Brinckerhoff, William B.; Mahaffy, Paul R.; Chao, Kaunglin; Tolone, William J.; Ribarsky, William; Balandin, Sergey I.; Javidi, Bahram; Tu, Shu-I. Simulation of a miniature, low-power time-of-flight mass spectrometer for in situ analysis of planetary atmospheres. volume 6983, year 2008, pages 69590E-69590E-15. doi:10.1117/12.780113, online – simulated and experimental TOF-MS spectra
google
"simion" "simulated spectrum"for more examples, e.g. link (spectrum, 100000 electron traces)