Plotting Fields
There are various ways to plot fields in SIMION.
Potential energy (“PE”) surfaces on the View screen.
“Contours” plots (equipotential and field gradient magnitude contours) on the View screen.
contour plotting library (contourlib) to plot field vectors or field lines (see SIMION Example: contour). This is most easily done in SIMION 8.1 (a more awkward implemention was provided in 8.0). Some examples use this to plot magnetic fields, such as seen in Helmholtz Coil. Internally this uses the
simion.experimental.plot_line_segment()function in Lua to plot 3D lines on the View screen.3D OpenGL Color PA Plot technique (see below). This reuses the 3D (OpenGL) PA plotting capabilties for field display.
Exporting fields for plotting in other programs. See Importing and Exporting Field and Potential Array Data.
PE and Contour Functions in View Screen
Potential energy surface views are described in Section 7.4.3 (page 7-26) SIMION User Manual. Potential contour lines are described in Section 7.6.4 (page 7-20) of the SIMION User Manual. If your geometry is 3D, you should also read about doing 3D cuts (around page 7-21) because the plots are over a 2D cross section of the geometry so you need to first cut out a 2D cross section of the 3D geometry to plot over. Here’s is a screencast: http://simion.com/screencast/3dzoom-contours .
Field lines are not displayed by the Contour function, but they would be perpendicular to the contour lines displayed. So, if your PA contains electric potential, then the electric field would run perpendicular to the contour lines of electric potential. If your PA contains magnetic scalar potential (like mag90.iob in SIMION Example: magnet), then the magnetic field lines would run perpendicular to the contour lines of magnetic scalar potential.
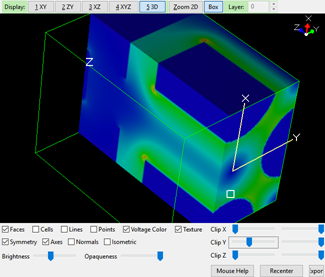
3D OpenGL Color PA Plots
One way to generate nice 3D color plots of fields or other data is to create a PA of electrode points with potentials being the values to plot. Then use the Modify screen “3D” view (in SIMION 8.1 or SL Tools) to display it, possibly with X/Y/Z clipping to see inside.
A Lua utility to create such a PA is demonstrated in SIMION Example: misc (“field_color_pa.lua”, added in 2016-12-14, SIMION 8.1).
--[[
 field_color_pa.lua
 Generates PA identical to first PA in memory
 but containing field magnitudes, suitable for plotting
 in Modify 3D OpenGL Views.

 To use:
 - Load a PA into the first memory position (use Remove All PA from RAM
   if necessary before loading).
 - Click Run Lua Program and select this Lua file to run.
   That creates a second PA file containing field magnitudes.
 - Open the second PA in Modify and use the "3D" view to
   display it.
--]]

local pa = simion.pas[1]

-- Create second array with same dimensions.
local pa2 = simion.pas[2]
if not pa2 then
  pa2 = simion.pas:open()
end
pa2:size(pa:size())
pa2.symmetry = pa.symmetry
pa2.dx_mm,pa2.dy_mm,pa2.dz_mm = pa.dx_mm,pa.dy_mm,pa.dz_mm
pa2.name = pa.name:gsub('%.[a-zA-Z]+', '-plot.pa')

-- Get range.
local Emax, Emin
for x,y,z in pa:points() do
  local Ex,Ey,Ez = pa:field_vc(x,y,z)
  local E = math.sqrt(Ex^2 + Ey^2 + Ez^2)
  Emax = math.max(Emax or E, E)
  Emin = math.min(Emin or E, E)
end
if Emax == Emin then Emax = Emin + 1 end -- avoid divide-by-zero
print('Emin, Emax=', Emin, Emax)

-- Set colors.
for x,y,z in pa:points() do
  local Ex,Ey,Ez = pa:field_vc(x,y,z)
  local E = math.sqrt(Ex^2 + Ey^2 + Ez^2)
  local Enorm = (E - Emin) / (Emax - Emin)
  Enorm = (1 - Enorm) * 0.6 --  rescale to [0 blue low, 0.6 red high]
  pa2:point(x,y,z, Enorm, true)
end